2026 Roadmap for EM-DAT
2025: A Turning Point for the EM-DAT Emergency Events Database After more than 20 years of support, the USAID grant that …


We are excited to announce the release of the EM-VIEW Disaster Dashboard, a powerful new tool designed to increase and speed up data visualization capacity for the EM-DAT User Community. This dashboard is now ready to be used with the EM-DAT Public Database, allowing seamless access to comprehensive global disaster data. The EM-VIEW Dashboard brings disaster data to life, enabling users to explore, analyze, and visualize data without the need for additional tools or programming expertise.
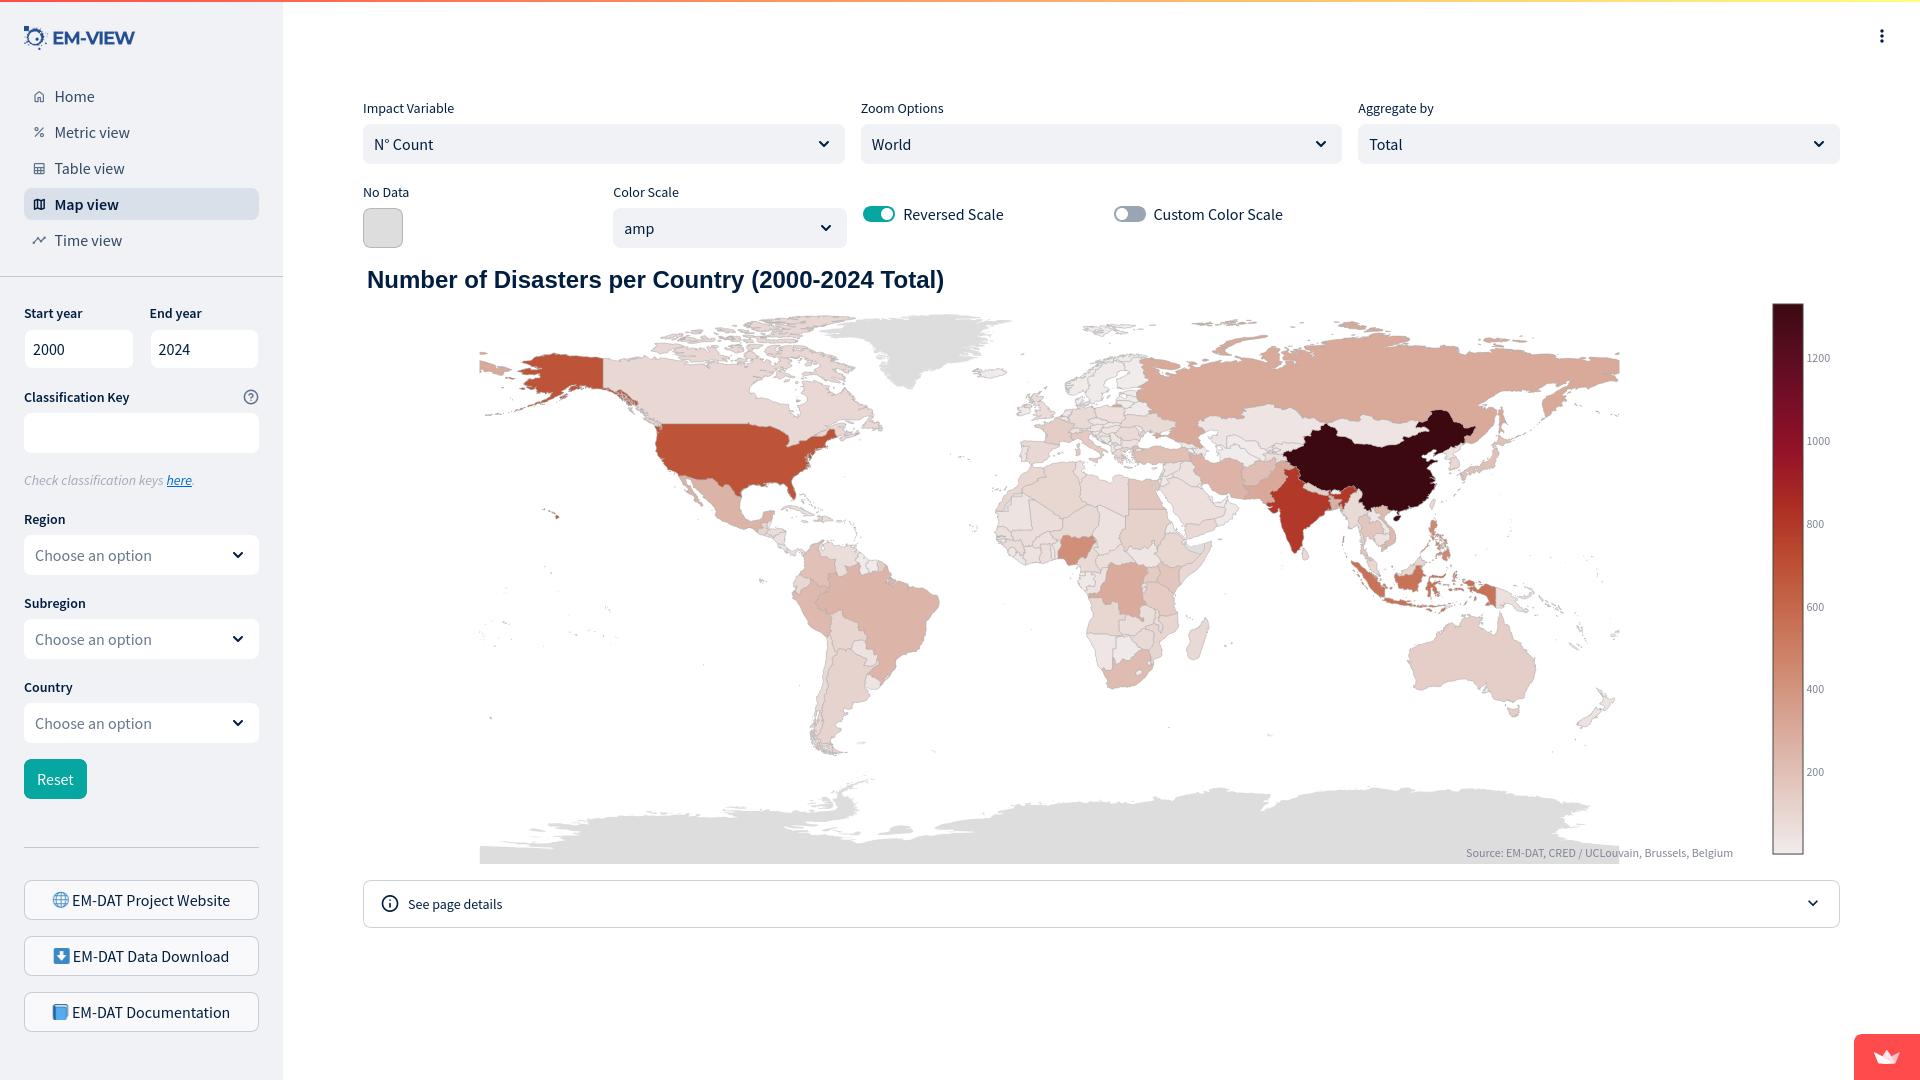
EM-VIEW Community Disaster Dashboard (Map View)
The EM-VIEW Dashboard is designed to streamline the data analysis process, making it easier than ever to derive meaningful information from disaster data. Whether you are conducting academic research, preparing policy reports, or developing disaster response strategies, this tool empowers you with:
The dashboard is powered by the trending Streamlit library, the EM-VIEW Dashboard offers various filtering options - by year, disaster type, or regions – and a suite of interactive visualizations:
The dashboard is pre-configured to work directly with the EM-DAT Public Data, available for non-commercial use. To begin using the EM-VIEW Dashboard, simply download the dataset as an Excel file from the EM-DAT Data Portal and upload or drag-and-drop it into the dashboard. That’s it, no more tedious chart creation—just instant insights and effortless visualization!
Not familiar with the database? Feel free to access the EM-DAT Documentation to better understand and interpret the data. We encourage you to explore the EM-VIEW Dashboard and all available resources and discover how it can enhance your disaster research and response efforts.
Are you a Python developer? You can access the EM-VIEW GitHub Project and fork it to customize the dashboard to fit your own needs, using the fast and efficient Streamlit web app library.
Have you developed another mature visualization solution and would like to share it with the EM-DAT user community? Contact the EM-DAT team to have your tool referenced in EM-DAT’s useful External Resources so that as many people as possible can benefit from it!
2025: A Turning Point for the EM-DAT Emergency Events Database After more than 20 years of support, the USAID grant that …
This content is published in the 79th issue of the CRED Crunch Newsletter (subscribe here). Recently, the Emergency …